### Load userfriendlyscience package to easily import data

### Import data
dat.raw <- read.csv(here::here("data",
                               "Vacc_HPHH_publicDataset.csv"));

### Remove participants that only provided t0 data
dat <- dat.raw[!is.na(dat.raw$VaxAttitudeChangeScore), ];

### Set condition to factor
dat$Condition <- factor(dat$Condition);

### Add a variable for the word count
dat$wordcount <- ifelse(dat$Condition=="Disease Risk", 344,
                        ifelse(dat$Condition=="Autism Correction", 251,
ifelse(dat$Condition=="Control", 193, NA)));Earlier (ok, in the only previous, first post on this blog) I discussed the recent study of Zachary Horne et al. (2015), where they concluded that threatening communication may be an effective approach to counter anti-vaccination attitudes. One of the problems with this study was that the manipulation was not valid: the conditions differed on many variables, any of which may explain the results they found.
After I deliberated for a while whether to inform the authors of the blog post, I decided to do so in the spirit of academic debate, transparency, and learning from each other. He swiftly replied, and one of the things he dis was correct my assumption that they did not share their data. They _did _actually share their data! I think that’s very commendable - I strongly believe that all researchers should Fully Disclose. Zachary posted it at the excellent (and free) Open Science Framework repository, specifically at http://osf.io/nx364. After having downloaded the data, I decided to write a brief follow-up post about matching of conditions and validity of manipulations.
The re-analysis
Before explaining the methodological theory explaining why matching is so crucial, let me show the re-analysis. I started by saving their datafile (which was stored as an Excel spreadsheet) as a Comma-Separated Values file, which you can easily import into R. I then proceeded to import it, remove participants that dropped out, and compute a variable representing the word count each participant was exposed to:
Then, I conduct a regression analysis where I predict each participants’ attitude change using the word count of their condition, and I stored the residuals in the datafile. This corrects the attitude change scores for the differences in word count; you can consider it a crude method to retroactively adjust for the violation of the validity of the manipulations.
### Remove variation explained by the word count
dat$VaxAttitudeChangeScore_correctedForWordCount <-
  lm(dat$VaxAttitudeChangeScore ~ dat$wordcount)$residuals;
I then repeat the original Analysis of Variance:
### Reproduce original Oneway Anova
rosetta::oneway(dat$VaxAttitudeChangeScore, dat$Condition, means=TRUE, plot=TRUE);
Registered S3 methods overwritten by 'ufs':
method from
pander.crossTab rosetta
pander.freq rosetta
print.crossTab rosetta
print.freq rosetta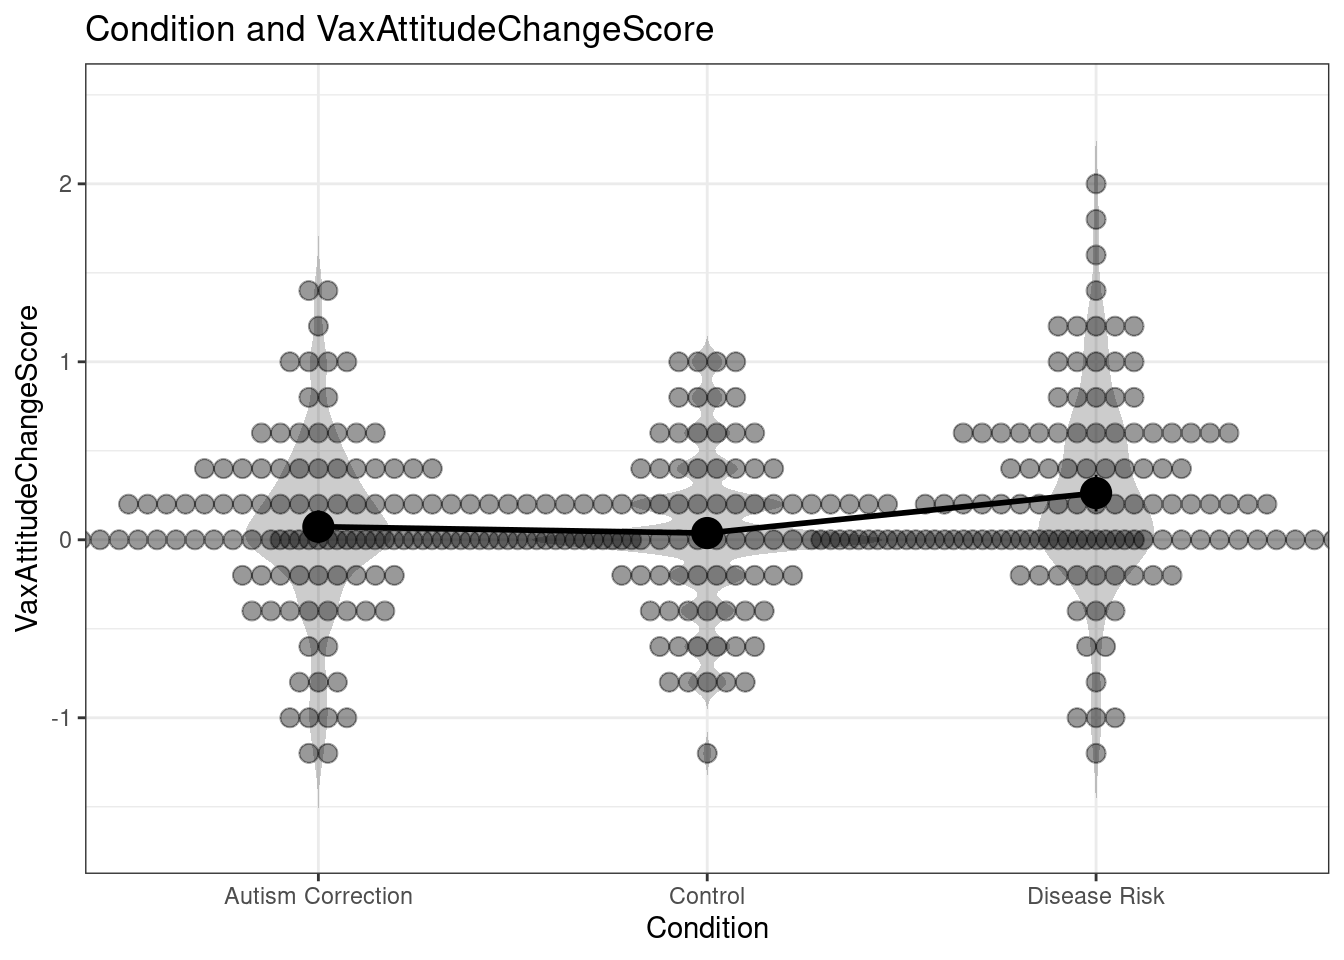
### Oneway Anova for y=VaxAttitudeChangeScore and x=Condition (groups: Autism Correction, Control, Disease Risk)

Omega squared: 95% CI = [.01; .08], point estimate = .03
Eta Squared: 95% CI = [.01; .08], point estimate = .04

                                   SS  Df   MS    F    p
Between groups (error + effect)  3.31   2 1.66 7.04 .001
Within groups (error only)      79.44 338 0.24

### Means for y (VaxAttitudeChangeScore) separate for each level of x (Condition):

Condition = Autism Correction:
    n  mean   sd median    se
  112 0.073 0.49      0 0.046

Condition = Control:
    n  mean  sd median    se
  117 0.038 0.4      0 0.037

Condition = Disease Risk:
    n mean   sd median    se
  112 0.26 0.55    0.2 0.052
This reproduces the findings of Horne et al (if I’d had this before, I wouldn’t have had to use WebPlotDigitizer of course). So this is good news (it wouldn’t be the first time when re-analysis of a dataset yields different results . . . One of the advantages of posting data alongside a paper is paying more attention everything is analysed and reported properly).
After this check, we can repeat the Analysis of Variance with the corrected attitude change scores:
### Conduct oneway Anova using corrected attitude change scores
rosetta::oneway(dat$VaxAttitudeChangeScore_correctedForWordCount,
       dat$Condition, means=TRUE, plot=TRUE);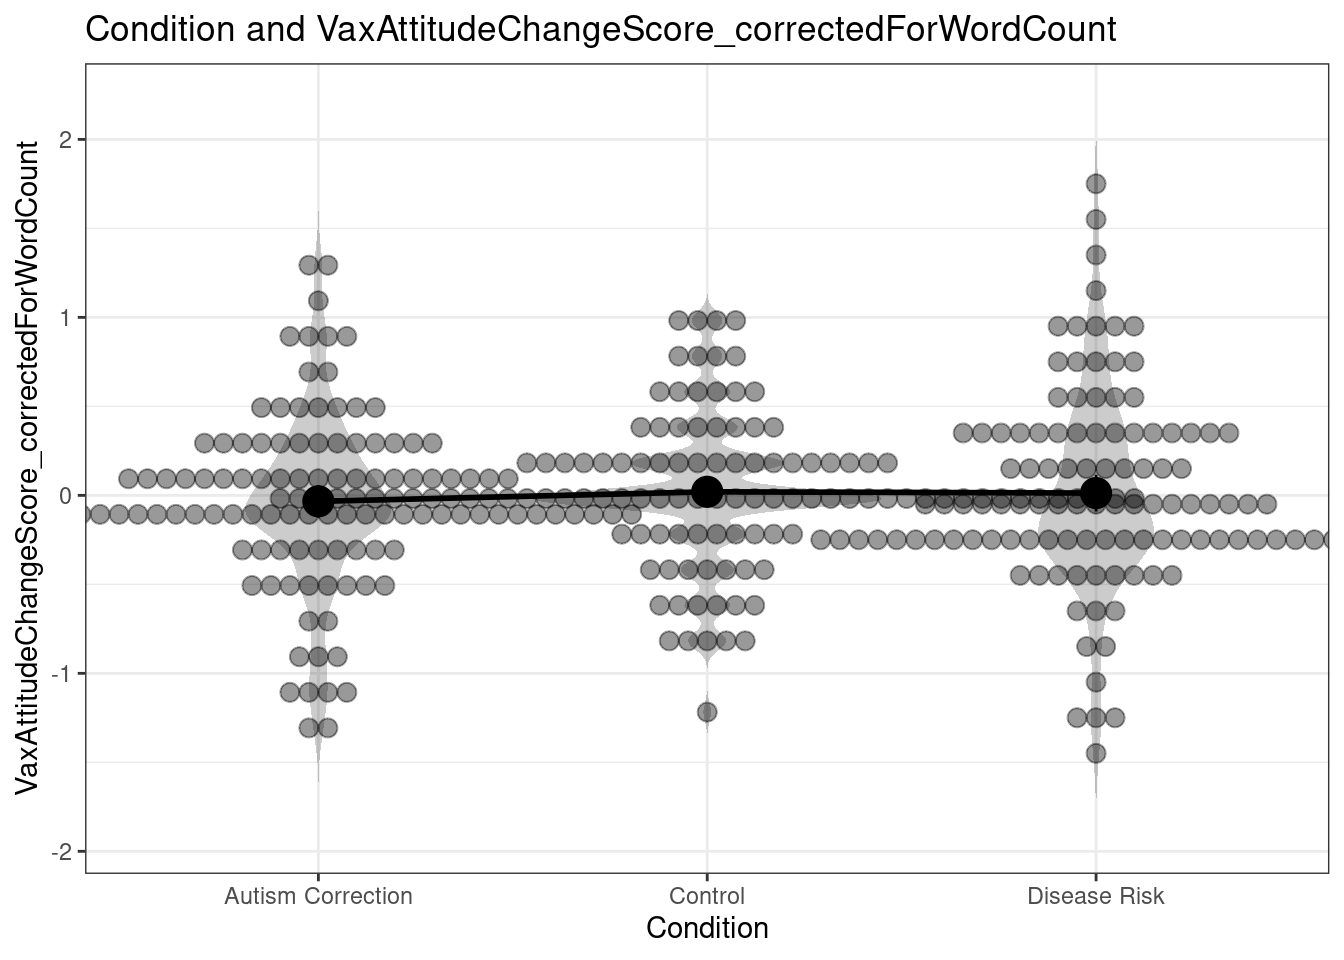
### Oneway Anova for y=VaxAttitudeChangeScore_correctedForWordCount and x=Condition (groups: Autism Correction, Control, Disease Risk)

Omega squared: 95% CI = [NA; .02], point estimate = 0
Eta Squared: 95% CI = [0; .01], point estimate = 0

                                   SS  Df   MS    F    p
Between groups (error + effect)  0.19   2  0.1 0.41 .666
Within groups (error only)      79.44 338 0.24

### Means for y (VaxAttitudeChangeScore_correctedForWordCount) separate for each level of x (Condition):

Condition = Autism Correction:
    n   mean   sd median    se
  112 -0.034 0.49  -0.11 0.046

Condition = Control:
    n mean  sd median    se
  117 0.02 0.4 -0.018 0.037

Condition = Disease Risk:
    n  mean   sd median    se
  112 0.013 0.55  -0.05 0.052
As you can see the Analysis of Variance is no longer significant (it doesn’t even come close at p = .666). That means that even if the study hadn’t suffered from the other problems (but it does, see the original post for a list), it would not be possible to draw the conclusion listed in the paper and the abstract:
[t]his study shows that highlighting factual information about the dangers of communicable diseases can positively impact people’s attitudes to vaccination. This method outperformed alternative interventions aimed at undercutting vaccination myths.
After all, the difference between the conditions might as well have been explained simply by word length (or any of the other variables that differed between the conditions in addition to the one deliberately manipulated, like the use of images). Such are the dangers (and in fact, costs, both to scientific progress, in this case, public health, and to evidence-based policy, as policymakers and the general audience are misinformed about the results of research) of not matching your conditions.
Why and how you should match conditions
In science, any study is only as good as its design and its operationalisations. Studies without experimental designs have a hard time drawing strong conclusions about causality. Studies with measurements that consist of only one item suffer relatively large standard errors and therefore have less power than studies with similar sample sizes but measurement instruments with smaller standard errors. And studies with manipulations or measurements that lack validity can often not draw any conclusions at all.
I won’t try to summarize a methodology textbook here by trying to explain the concept of validity. Luckily, Nevit Dilmen made an excellent image illustrating what validity is:
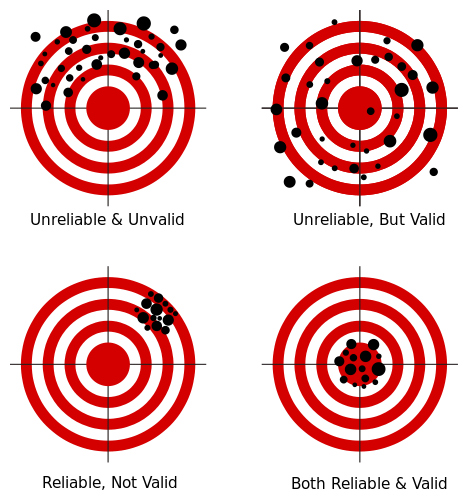
The bottom line is: validity is whether you measure what you want to measure (reliability is how accurately each measurement is), or, when talking about manipulations, whether the conditions differ only in the variable of interest.
In the study by Horne et al. (2015), they were interested in the difference between an intervention that targets beliefs about autism as a consequence of vaccination, an intervention that targets beliefs about the severity of the potential consequences of not getting your child vaccinated, and text about bird feeding. However, the operationalization of those three levels of their independent variable was heavily flawed. One example is explained above: the word count was different between these conditions. And this word count explained all the variation in their dependent measure. Similarly, their intervention of interest, the ‘Disease Risk’ one, was the only one that included images.
But, there are many more, often much more subtle, ways in which you have to make sure your ‘control conditions’ are matched to your experimental conditions. I will explain two of them, using the now conveniently salient study by Horne et al. as an example.
Number of beliefs targeted by a manipulation
Let’s call the specific thoughts, ideas, memories that comprise more generic, abstract psychological variables ‘beliefs’. For example, the psychological variable of attitude typically consists of beliefs representing somebody’s perceived likelihood that a behavior has specific consequences (“If I skip my exercise today, it is very likely that I will feel less fit.”), combined with the (un)desirability of those consequences (“To me, feeling less fit is moderately undesirably.”). The items in questionnaires measuring psychological variables often represent such beliefs, as those measurement instruments try to tap the most central beliefs to map the underlying determinant.
Now, if you are interested in comparing one behavior change method with another, but your application of the first method targets four attitudinal beliefs, while your application of the other method only targets two attitudinal beliefs, you would expect a larger effect size for the first intervention, even if the two behavior change methods are equally effective . . .
For example, inspect the manipulations of Horne et al. (see their supplemental materials). The manipulation in the Autism Correction Condition targets an Injunctive Subjective Normative belief with the first sentence:
All children should be vaccinated for measles, mumps, and rubella.
The second sentence targets two beliefs, the first underlying Attitude and the second underlying Response Efficacy:
The measles, mumps, and rubella vaccine (MMR) is safe and effective.
The rest of the manipulation supports the attitudinal belief in this second sentence: all other sentences emphasize that no link has been found with autism. The Disease Risk condition looks quite different. It starts by targeting a belief underlying Susceptibility:
You or your child could catch these diseases by being around someone who has them. They spread from person to person through the air.
It then targets response efficacy with three sentences:
Measles, mumps, and rubella (MMR) vaccine can prevent these diseases. Most children who get their MMR shots will not get these diseases. Many more children would get them if we stopped vaccinating.
Then, an anecdote follows that can also influence susceptibility (scenario’s with risk information can be effective methods for influencing susceptibility). The text then continues, targeting beliefs underlying Severity:
All children should be vaccinated for measles, mumps, and rubella. These are serious diseases. […]
Measles virus causes rash, cough, runny nose, eye irritation, and fever. It can lead to ear infections, pneumonia, seizures (jerking and staring), brain damage, and death.
This goes on for a while. The number of beliefs targeted is much higher in the Fear Control intervention. In fact, the ‘dose’ of the intervention targeting Response Efficacy is also much higher than in the Autism Correction condition. As you can see, many more beliefs are targeted in the Disease Risk condition. That means that if both behavior change methods are equally effective, you would expect a higher effect size for the Disease Risk condition. That is, assuming these beliefs are represented in your dependent measure . . .
Do you measure what you manipulate?
Of course, it is also important that you can measure any changes caused by your manipulation. Therefore, you should measure all beliefs you target in your manipulation - or you should consistently only measure beliefs that are theoretically causal consequences of the beliefs or variables you manipulate. After all, even if both your manipulations target 4 beliefs, if your measurement instrument only measures two beliefs, both manipulated in the same condition, you would expect a larger effect size for that condition. Of course, psychological variables such as beliefs and determinants influence each other - but each ‘step’ in such a chain of influence means your effect size diminishes a bit. Therefore. it’s important that you have a match between your manipulations and your measurements.
Again referring to Horne et al. (2015) for our example, their measurement was:
- The risk of side effects outweighs any protective benefits of vaccines.
- Vaccinating healthy children helps protect others by stopping the spread of disease.
- I plan to vaccinate my children.
- Children do not need vaccines for diseases that are not common anymore.
- Doctors would not recommend vaccines if they were unsafe.
The first item measures an odd mix of attitudinal beliefs related to negative consequences of vaccines and attitudinal beliefs related to positive consequences of vaccines. Still, it does clearly seem to be an attitude item (or risk perception, which is a part of attitude). And it related to both the experimental condition (which focused on perceived benefits of vaccines) and the comparison condition (which focused on perceived risks of vaccines).
The second item primarily seems to assess Response Efficacy (how effective are vaccines at diminishing the threat?). Recall that this was targeted in both interventions, but more strongly in the Disease Risk intervention.
The third item is an intention item, a variable theoretically predicted by attitude, but any effect on attitudinal beliefs will be substantially diluted before it can engender any change in intention.
The fourth item seems an attitudinal item again, although it measures an aspect that none of the interventions explicitly seems to address (related to how common a disease currently is).
Finally, the fifth item mainly relates to trust in doctors: I can’t easily identify which determinant this would be a part of.
If you compute an aggregate measure, you’d expect the largest effect of the Disease risk intervention because the match between targeted and measured beliefs is best for that intervention. You’d expect this even if the behavior change methods are in fact equally effective.
How do you match conditions?
Most methodological and many statistical textbooks will have sections on this topic. However, in this post a few guidelines have emerged specifically to behavior change research:
In general: make sure that your condition are the same in all respects except the variable you are interested in (so equal word count, same medium, same colours, same exposure duration, etc).
Make sure you have an overview of which beliefs you target in each condition, and to which determinants they belong; and make sure you target the same number of beliefs in each intervention. (Ideally, you’re aware of how important each belief is for the behavior you’re studying, and you can take this into account, too.)
Make sure you have a clear idea about which beliefs you measure with your measuring instruments, and make sure you measure the same number of beliefs for each condition.
Of course, in an ideal world, you don’t embark upon any behavior change research without first having figured out which beliefs and determinants actually predict intention and behavior. That way, your findings will have optimal external validity. For an accessible introduction as to what beliefs and determinants are and how you figure out which ones are important for a given behavior, see this practical guide and for more background information, the other articles at http://effectivebehaviorchange.com.
However, even for research where you don’t have this information available, make sure you pay attention to matching. Neglecting these factors can have serious negative consequences. Marijn de Bruin wrote an impressive paper on this issue: it’s even possible that patients receive inferior healthcare if the issue of proper matching is neglected. The same is true for behavior change interventions (for details, see our paper about the subtleties of studying the effectiveness of behavior change methods).
For references, see the original post.